Monitoring Dashboard
This guide describes the Grafana monitoring dashboards provided in the existing monitoring stack of Katonic MLOps Platform.
Overview
Setting up monitoring for your Katonic Kubernetes cluster allows you to track your resource usage and analyze and debug application errors.
You can see the dashboard image from our Katonic Kubernetes cluster below:
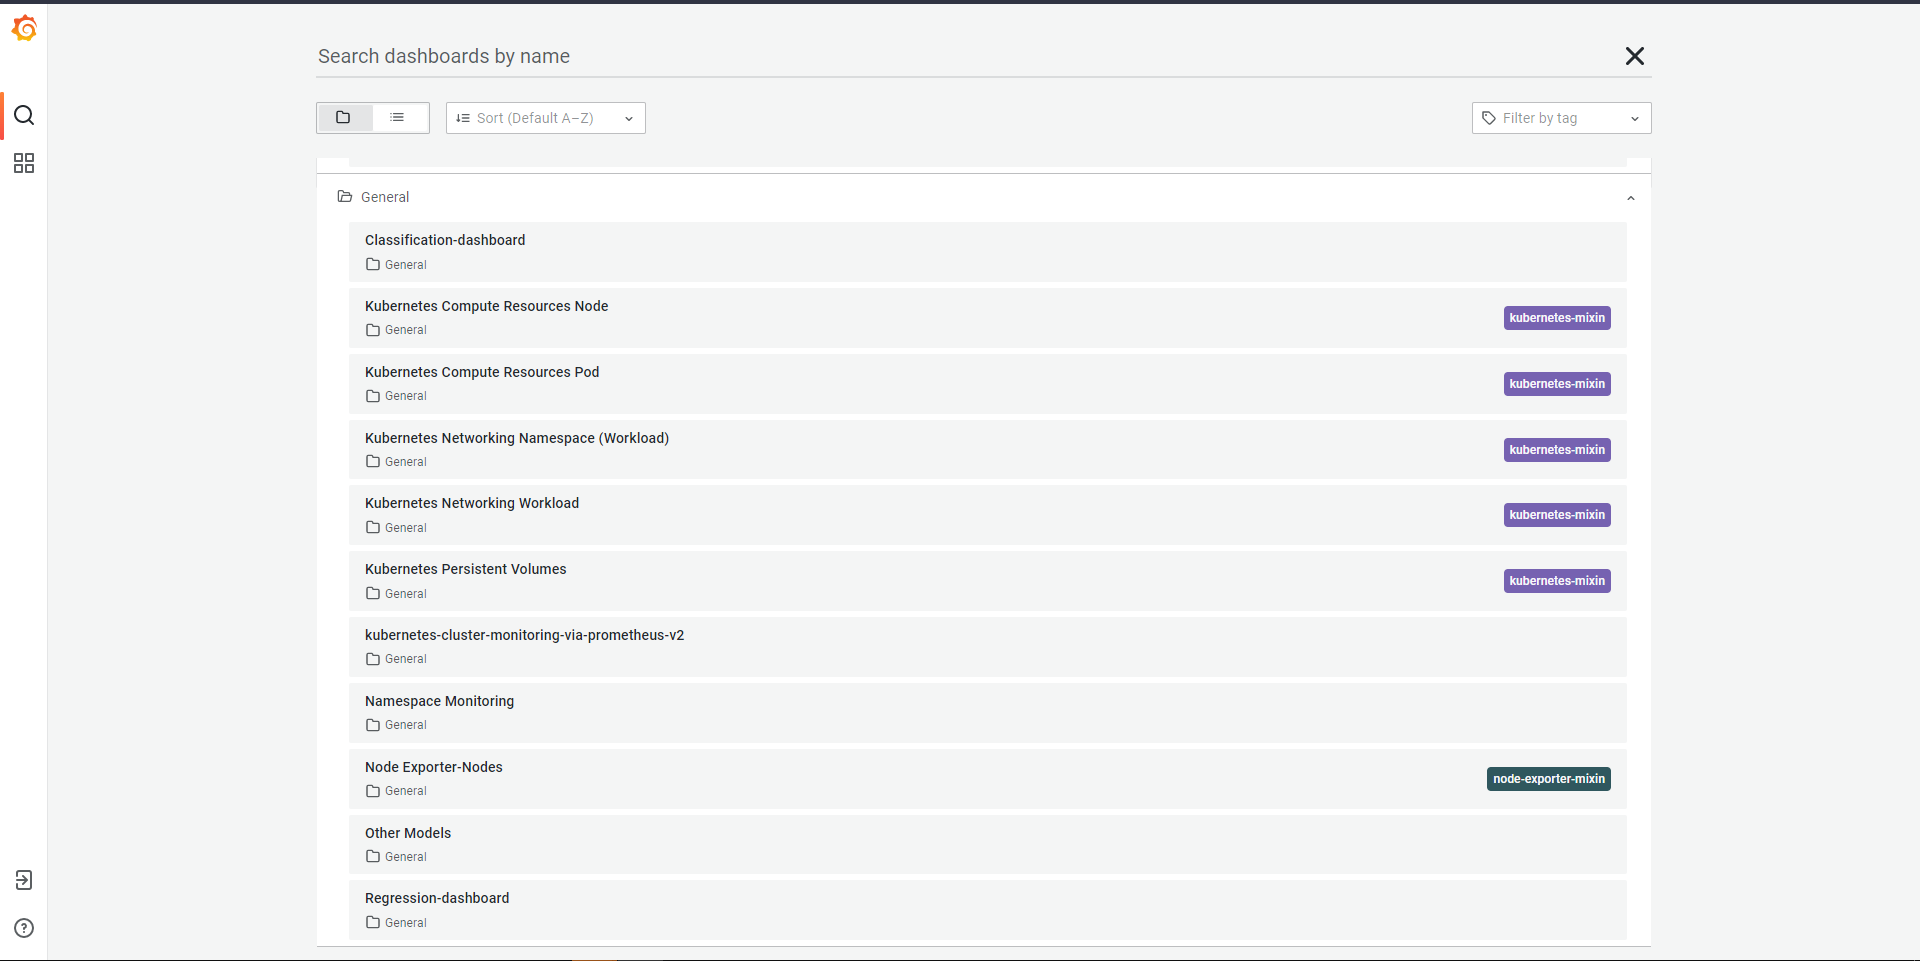
Katonic Monitoring Platform provides the following dashboards:
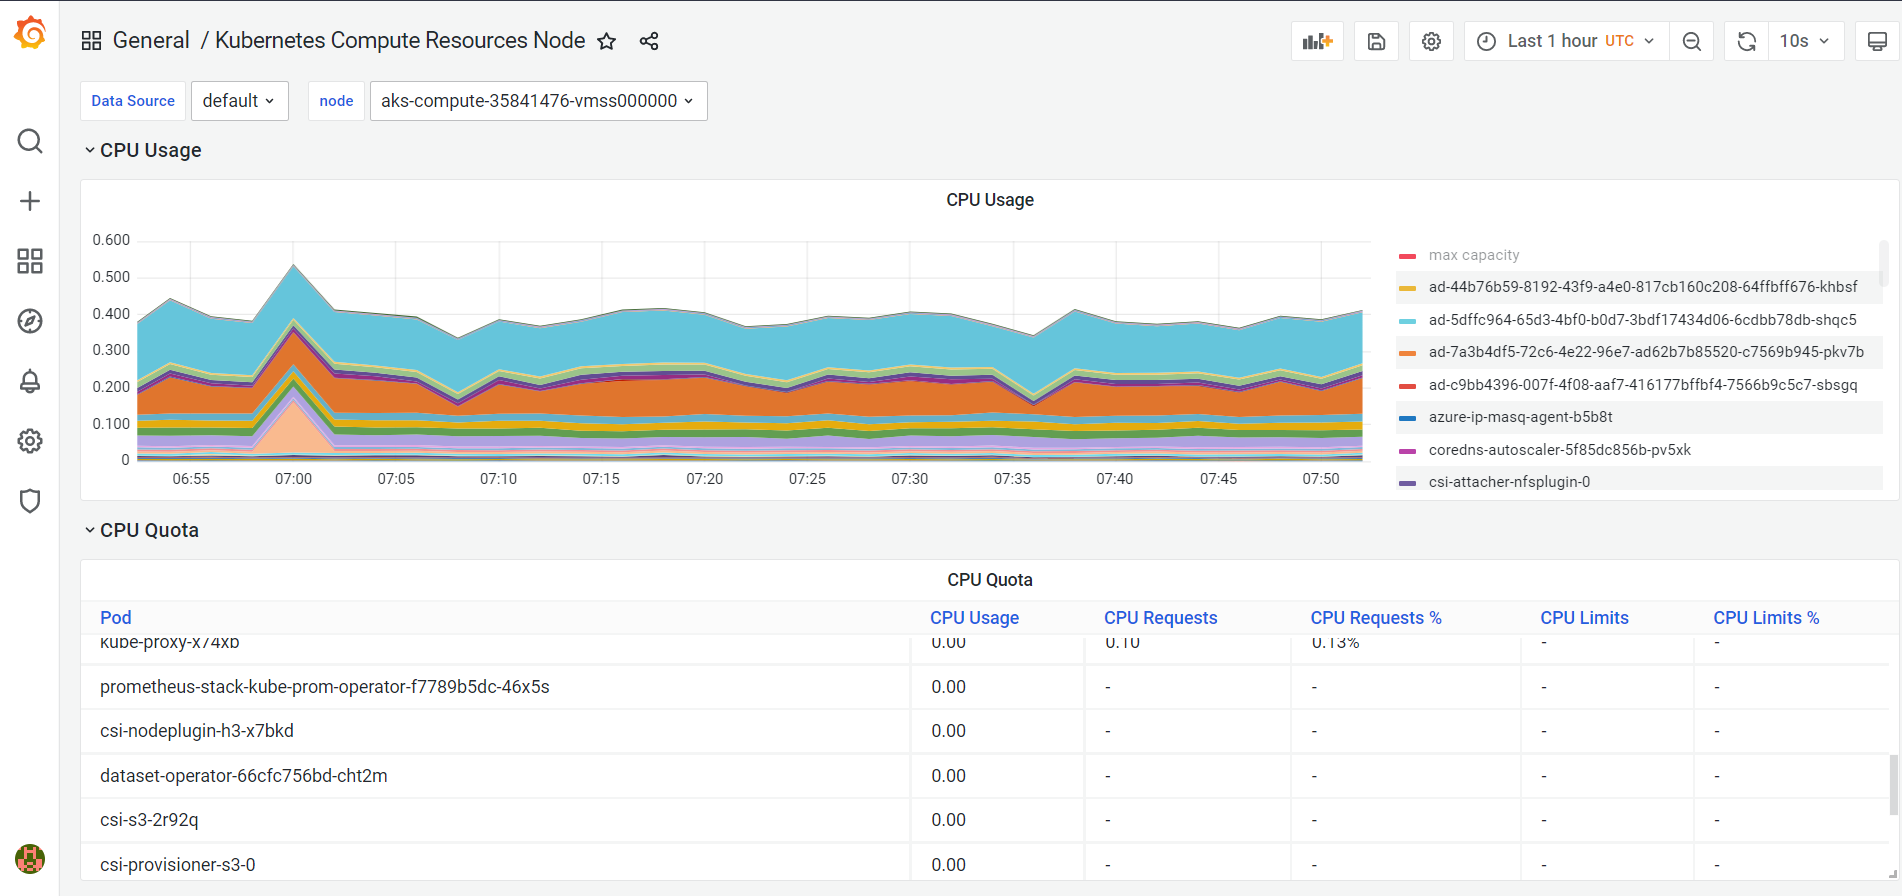
Kubernetes Compute Resources Node Dashboard
Kubernetes Compute Resources Node dashboard will give you the data of the existing nodes present in your cluster with existing data source which contains the following:
Node CPU Usage
Node CPU Quota
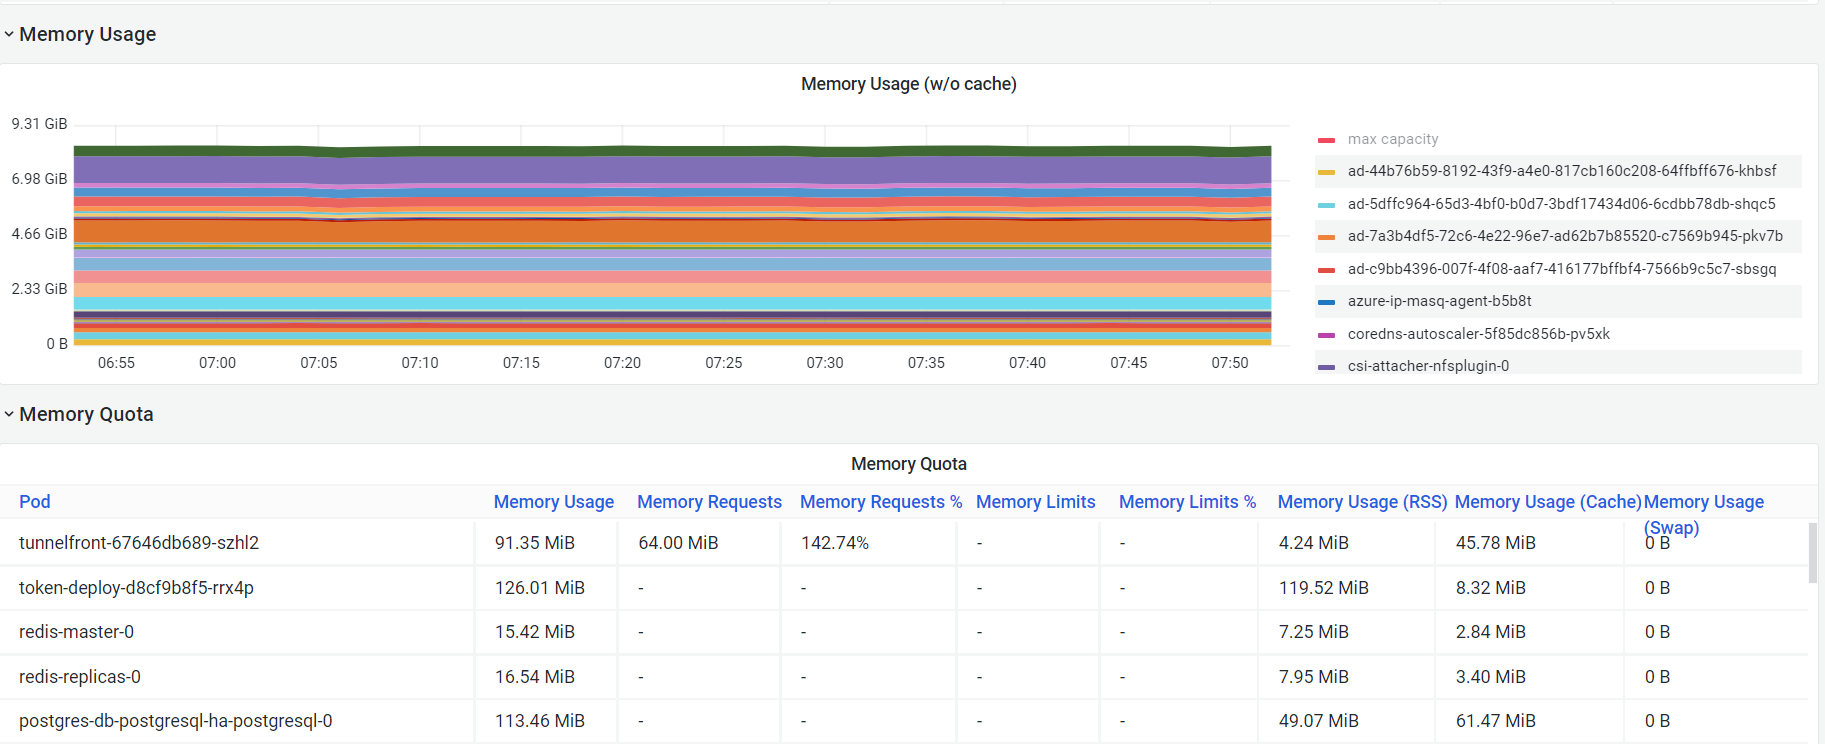
Node Memory Usage
Node Memory Quota
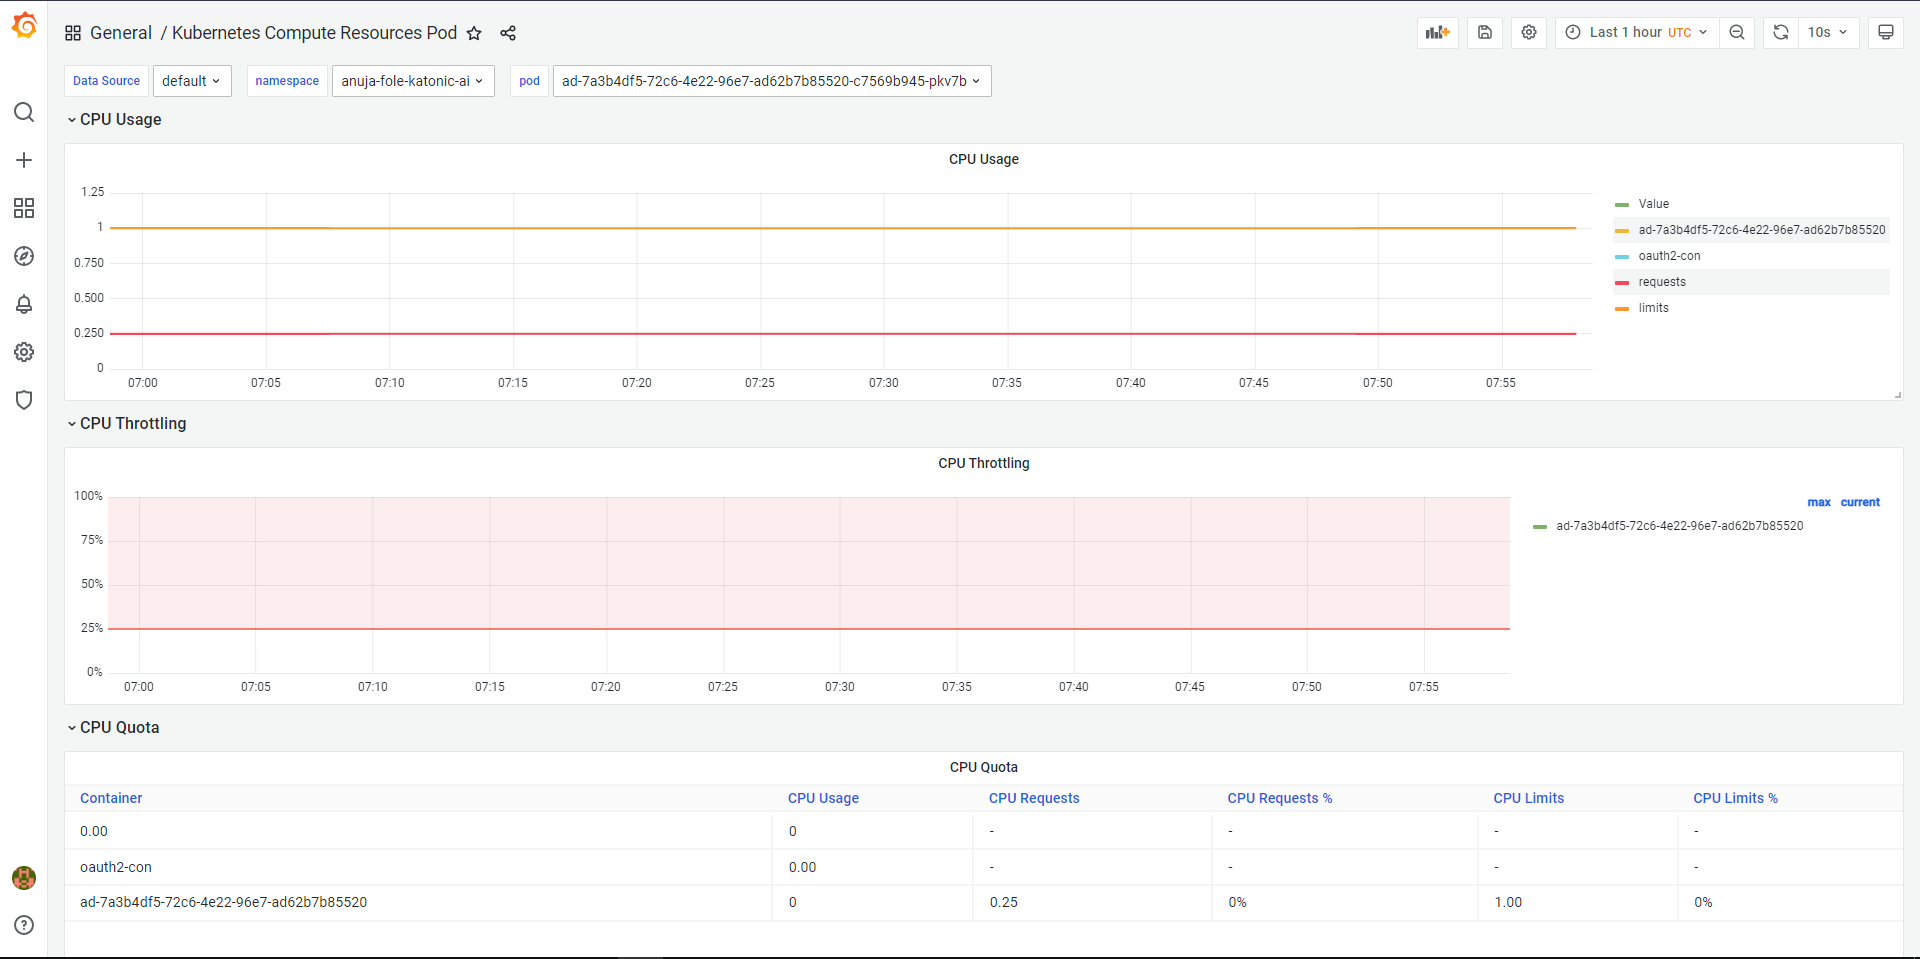
Kubernetes Compute Resources Pod Dashboard
Kubernetes Compute Resources Pod dashboard will give you the data of the existing pods present in your cluster with existing data source and the namespace which contains the following:
Pod CPU Usage
CPU Throttling
Pod CPU Quota
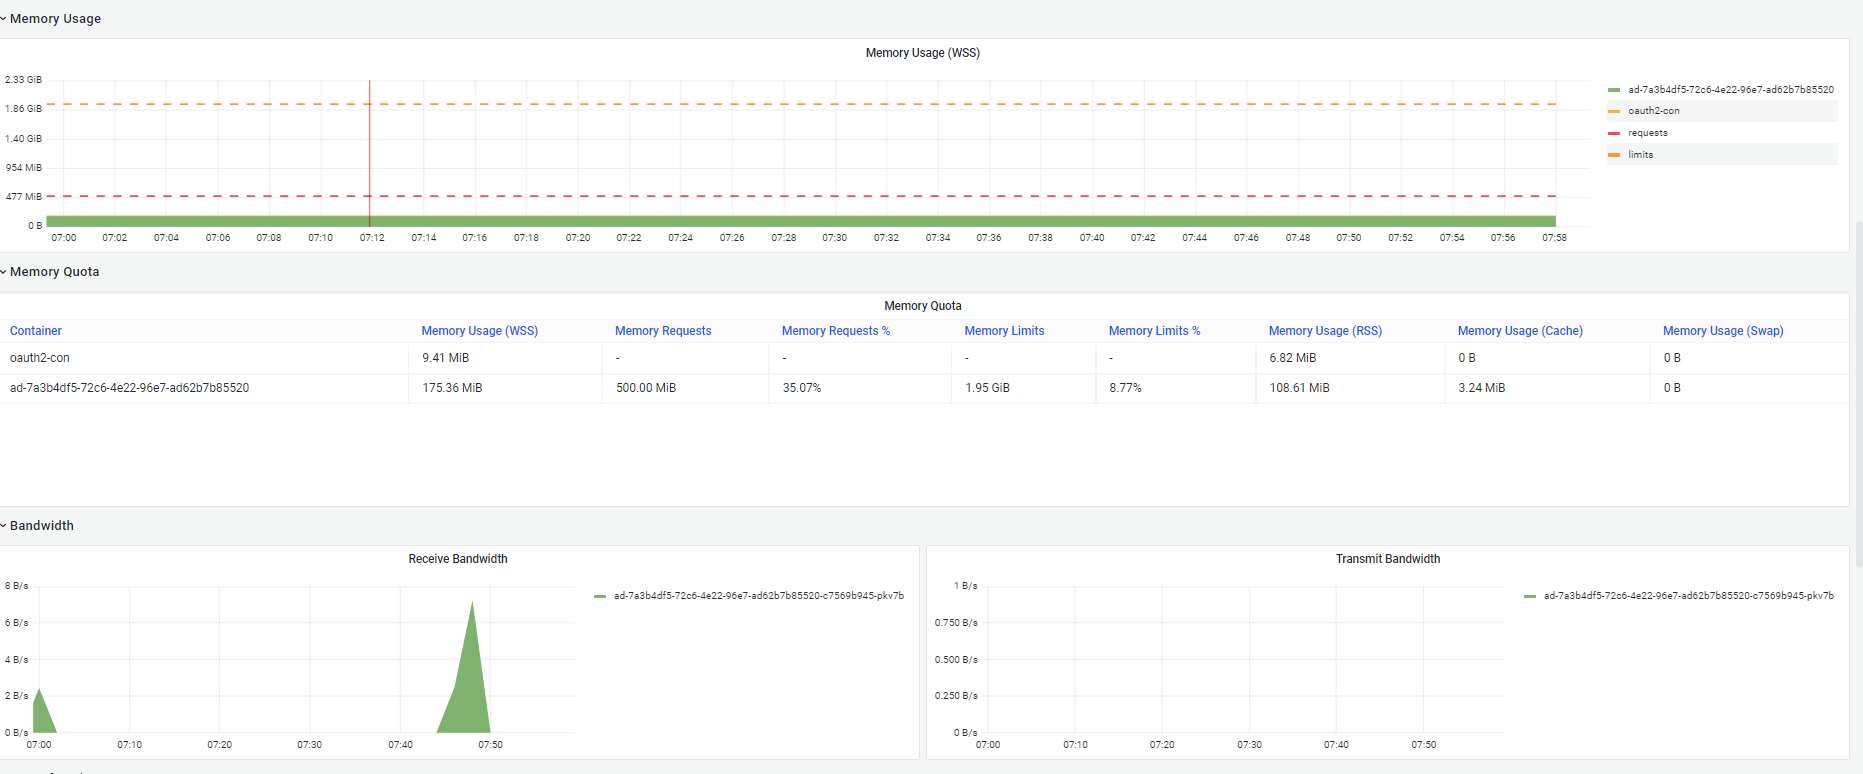
Pod Memory Usage and Quota
Received and Transmitted Bandwidth of Pods
Rates of Packet received and transmitted of Pods
Rates of Packet Dropped received and transmitted of Pods
Storage I/O Distribution of Pods

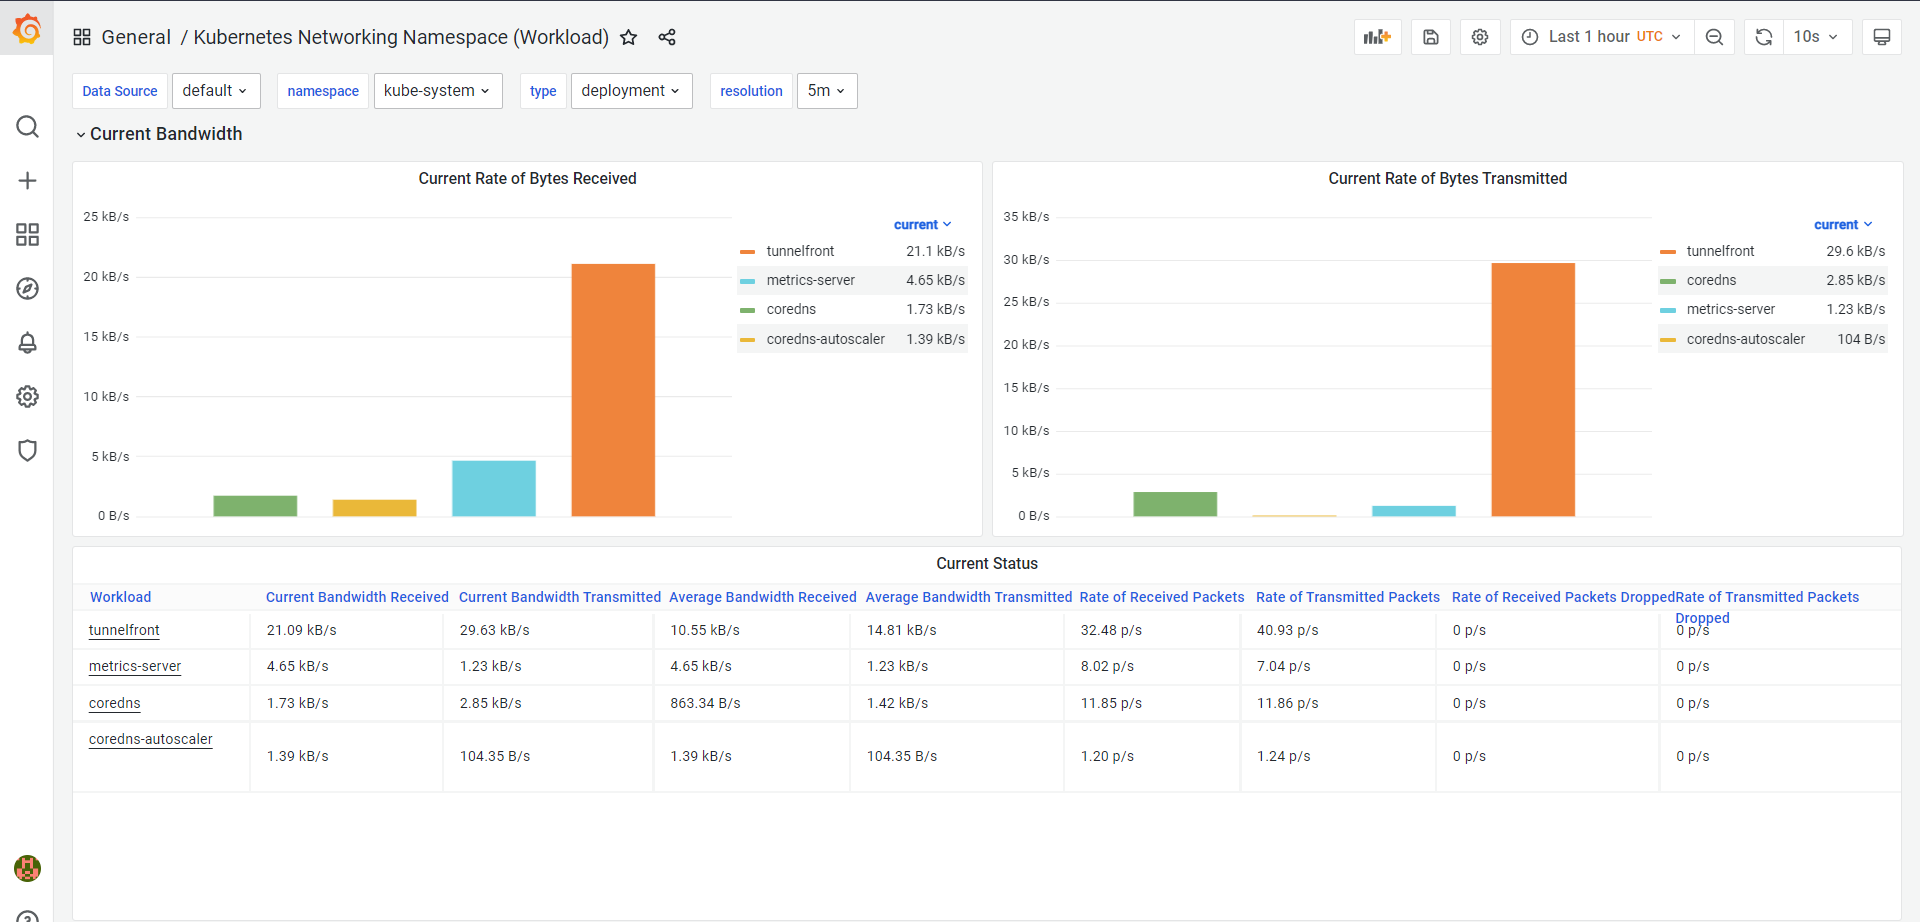
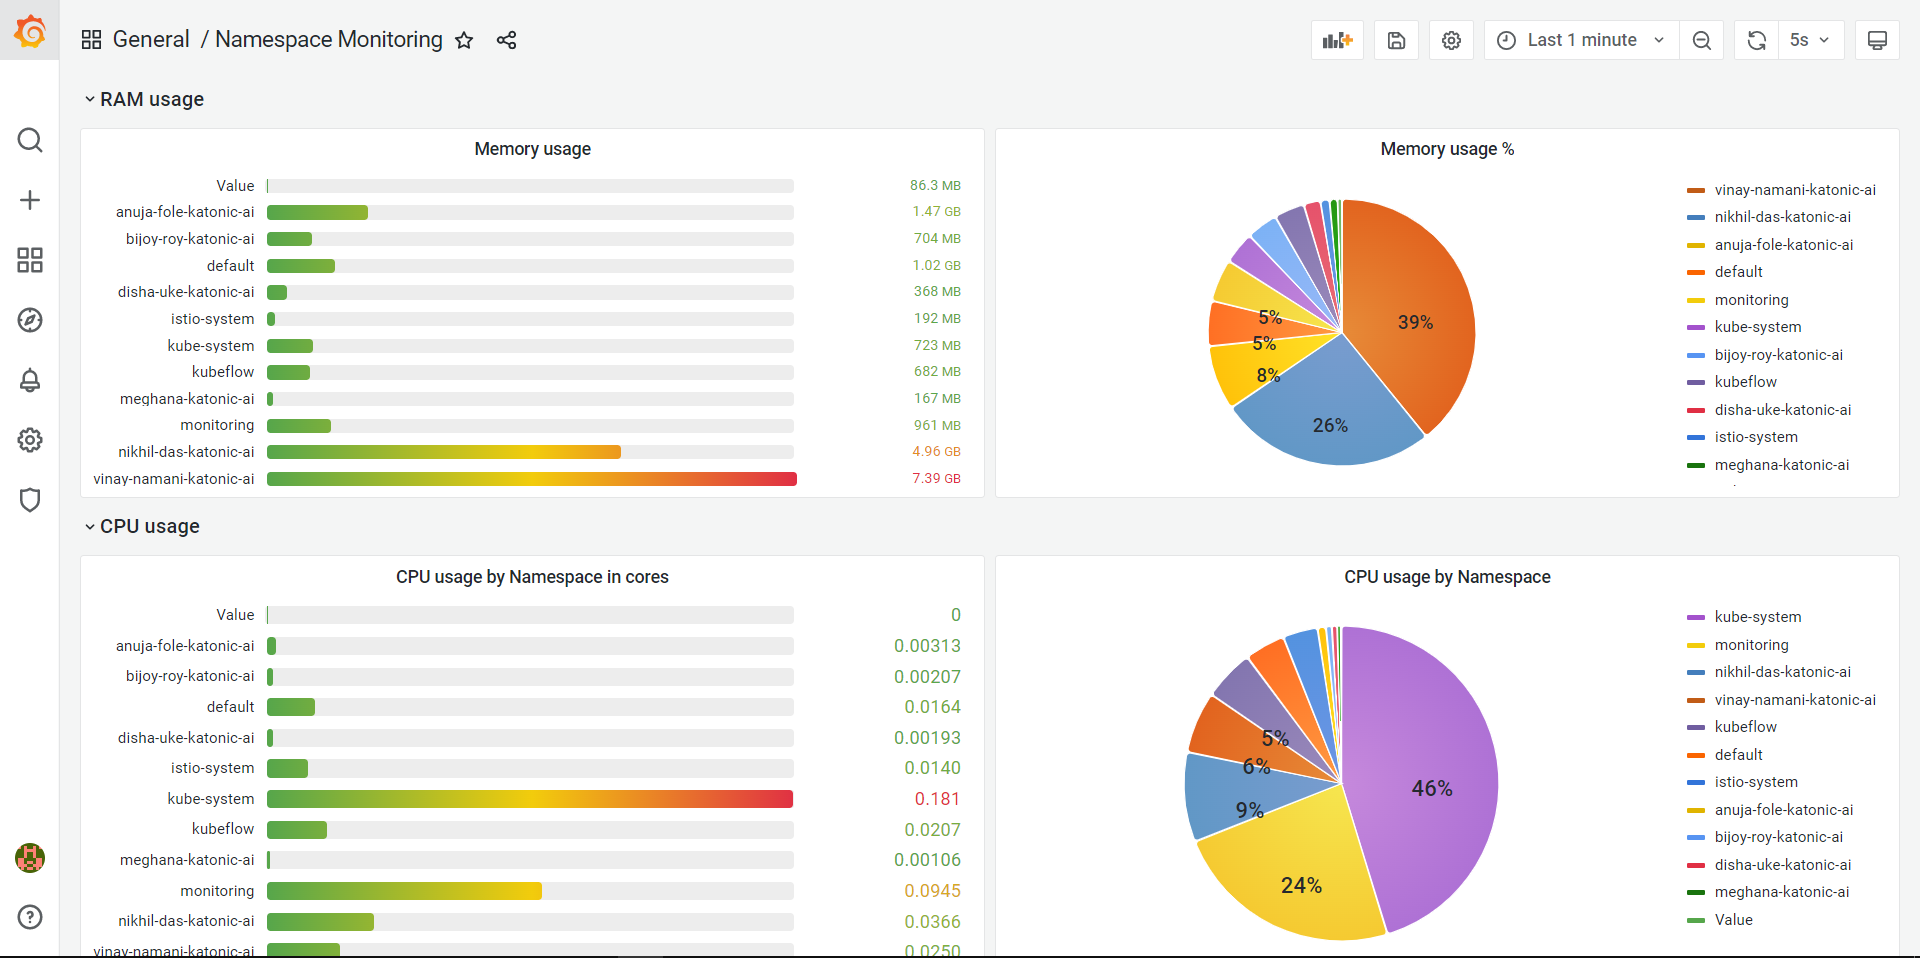
Kubernetes Networking Namespace (Workload) Dashboard
Kubernetes Networking Namespace (Workload) dashboard will give you the data of the existing namespaces present in your cluster with existing data source, type of resource and resolution which contains the following:
Current Bandwidth of Namespaces
Average Bandwidth of Namespaces
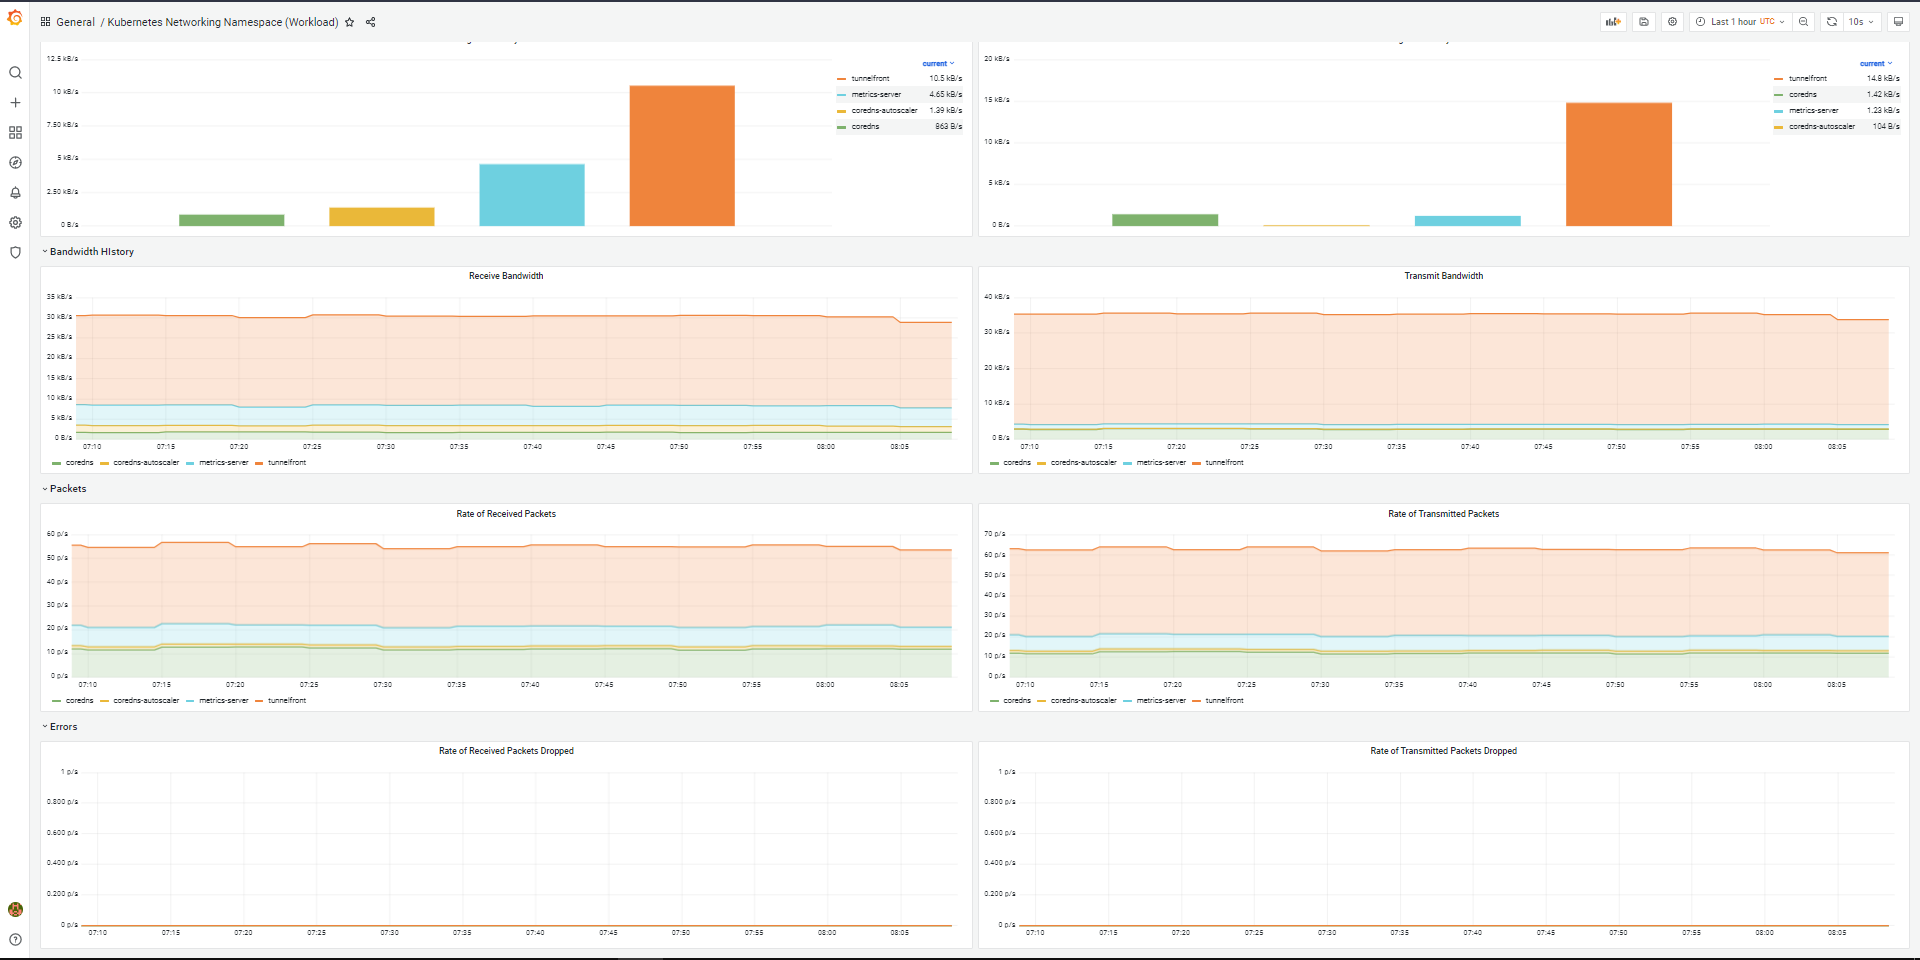
Bandwidth History
Packets
Errors (Rates of received packets dropped and Rates of transmitted packets dropped)
Memory and CPU Usage of each namespaces
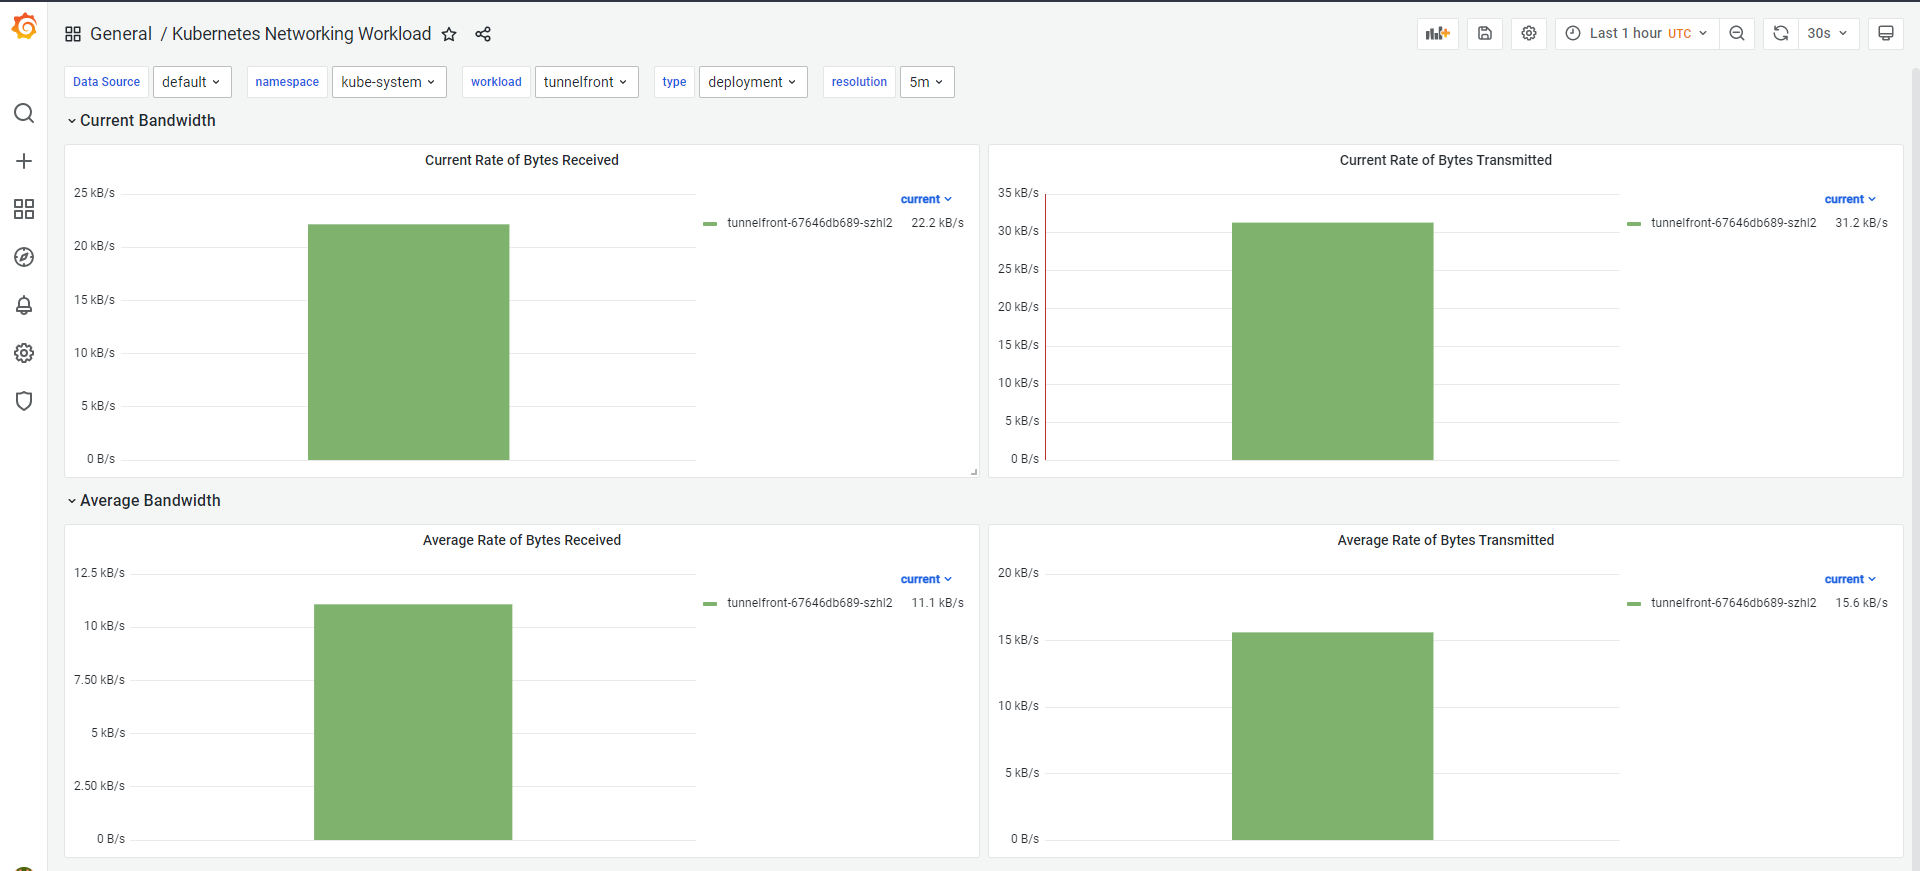
Kubernetes Networking Workload Dashboard
Kubernetes Networking Workload dashboard will give you the data of the networking workload present in your cluster with existing data source, namespaces , workload and type of resources which contains the following:
Current bandwidth of the workload
Average bandwidth of the workload
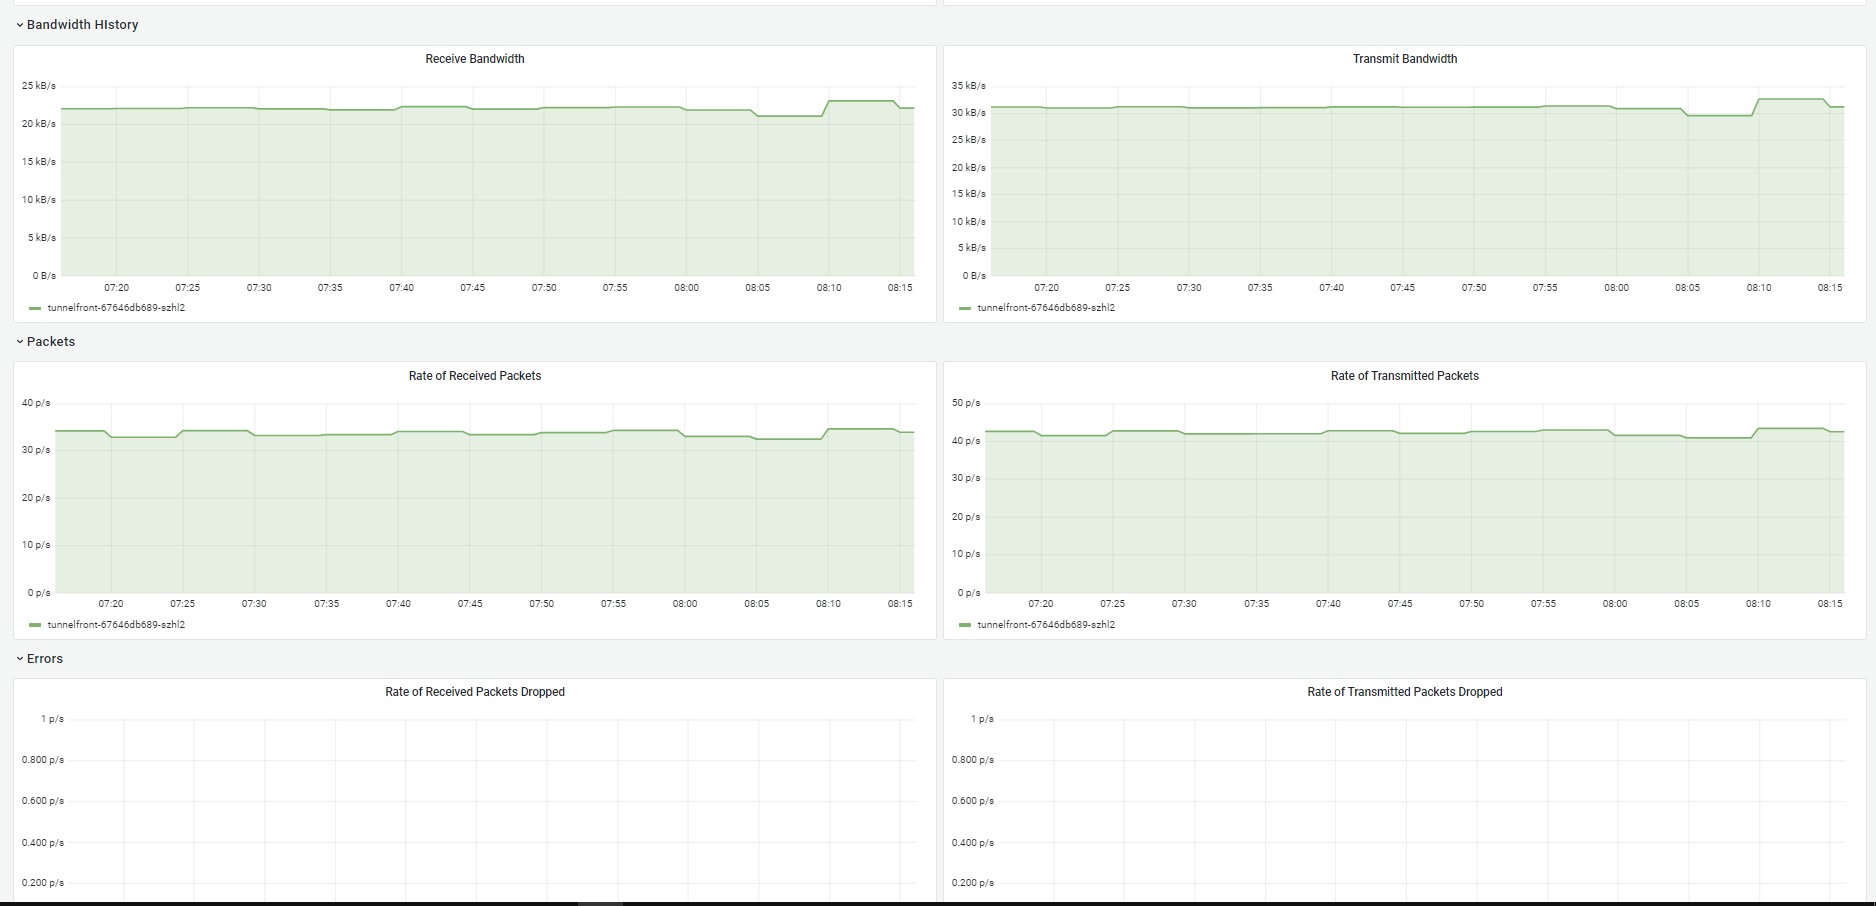
Bandwidth History
Network Packets transmitted and received
Errors (Rates of received packets dropped and Rates of transmitted packets dropped)
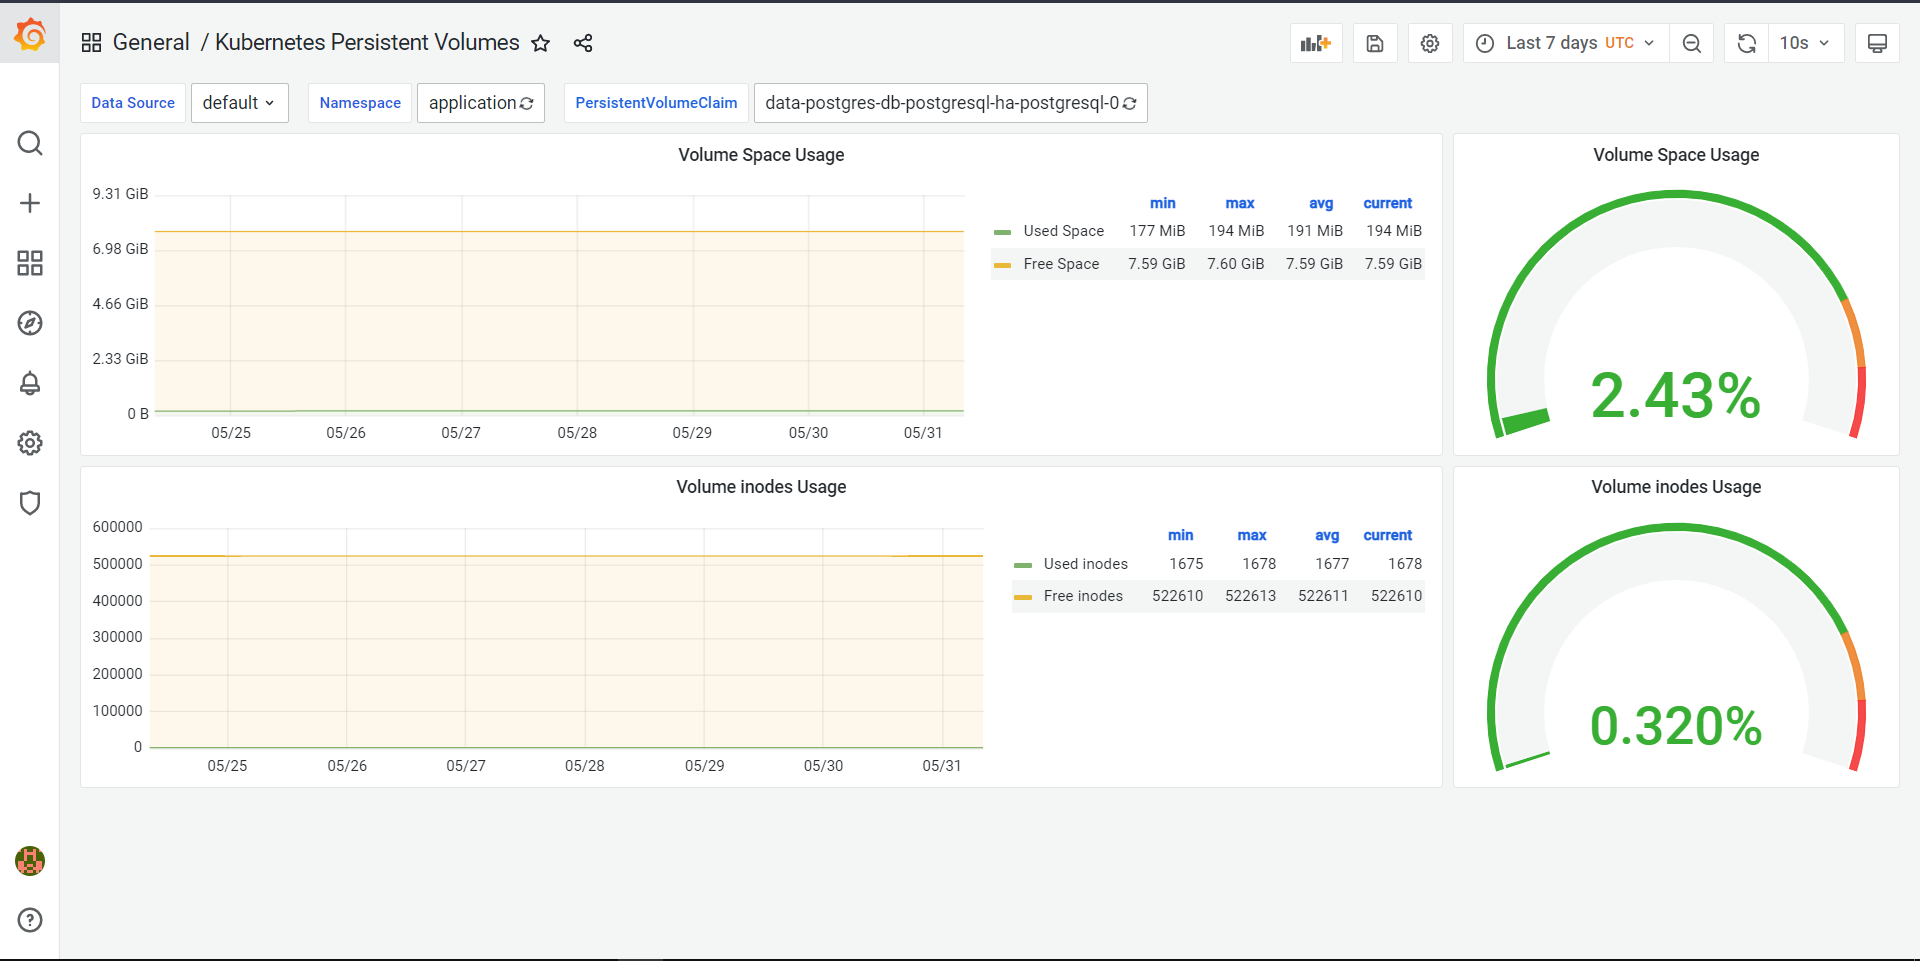
Kubernetes Persistent Volumes Dashboard
Kubernetes Persistent Volumes dashboard will give you the data of the persistent volumes present in your cluster with existing data source, namespaces and persistentvolumeClaims which contains the following:
Volume space usage by each namespace
Volume inodes usage
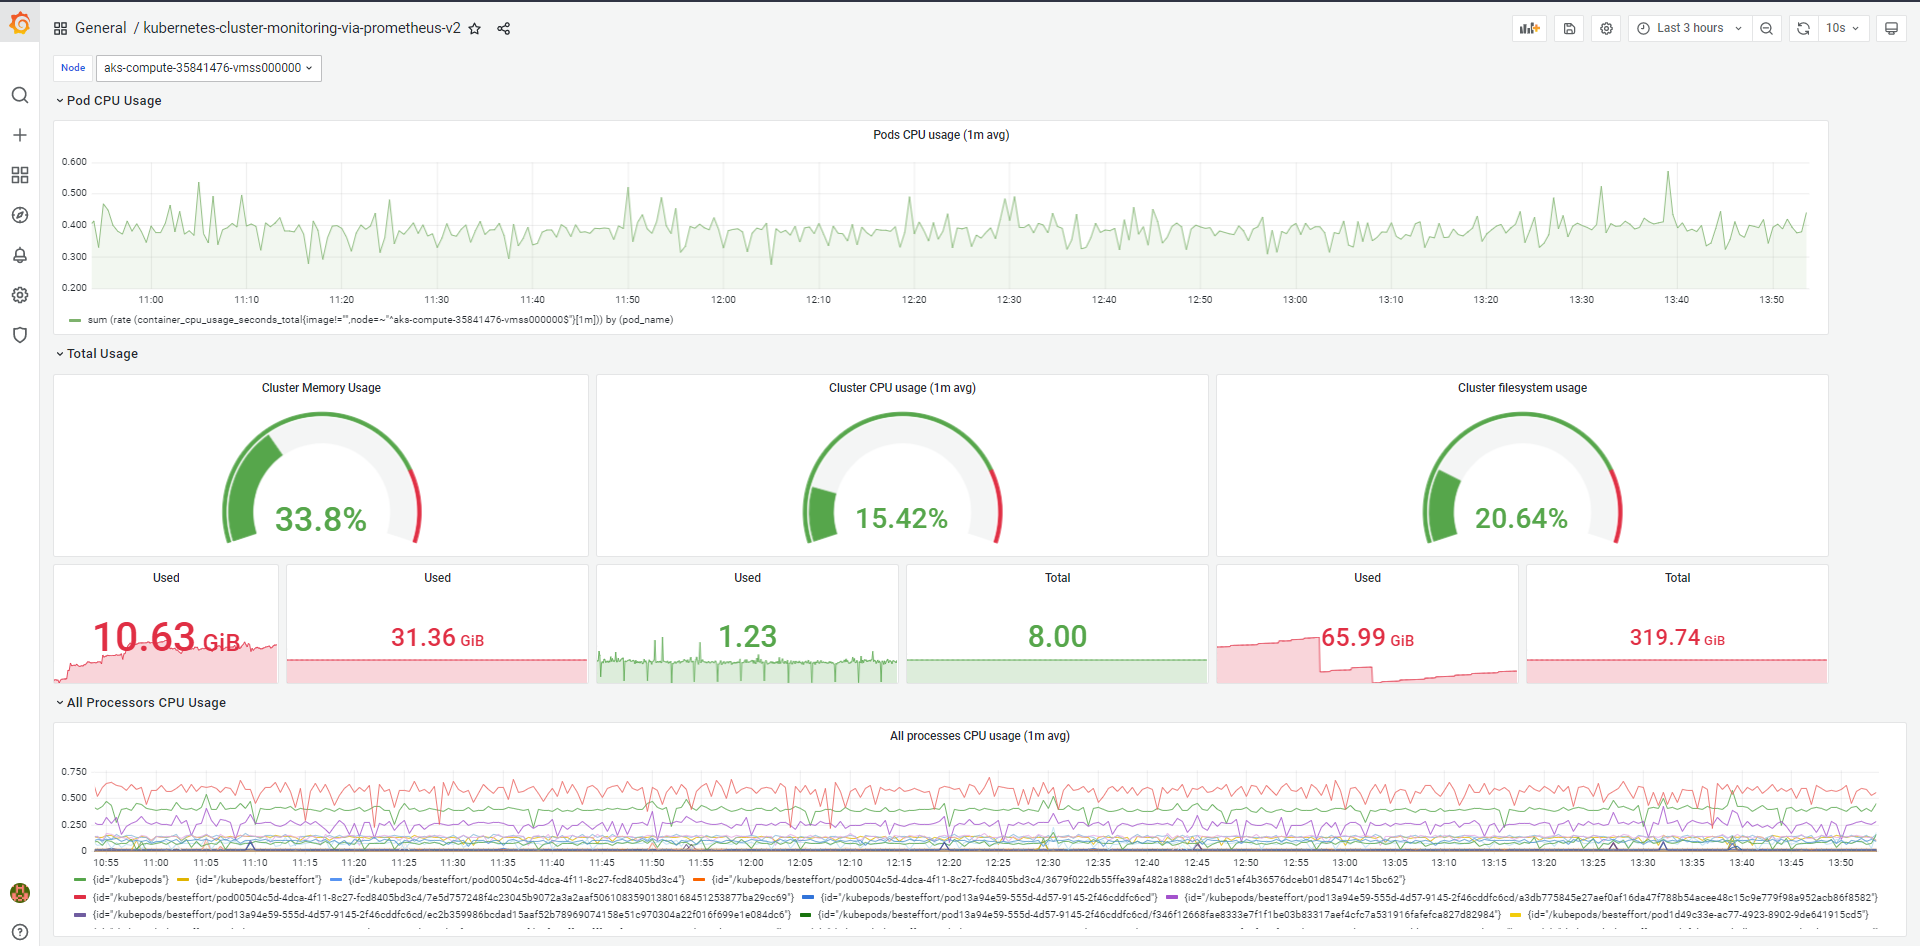
Kubernetes Cluster Monitoring Dashboard
Kubernetes Cluster Monitoring dashboard will give you the entire data of the cluster monitoring by existing nodes which contains the following:
Pod CPU Usage
Total Usage (Memory, CPU, Filesystem)
All Processor’s CPU Usage
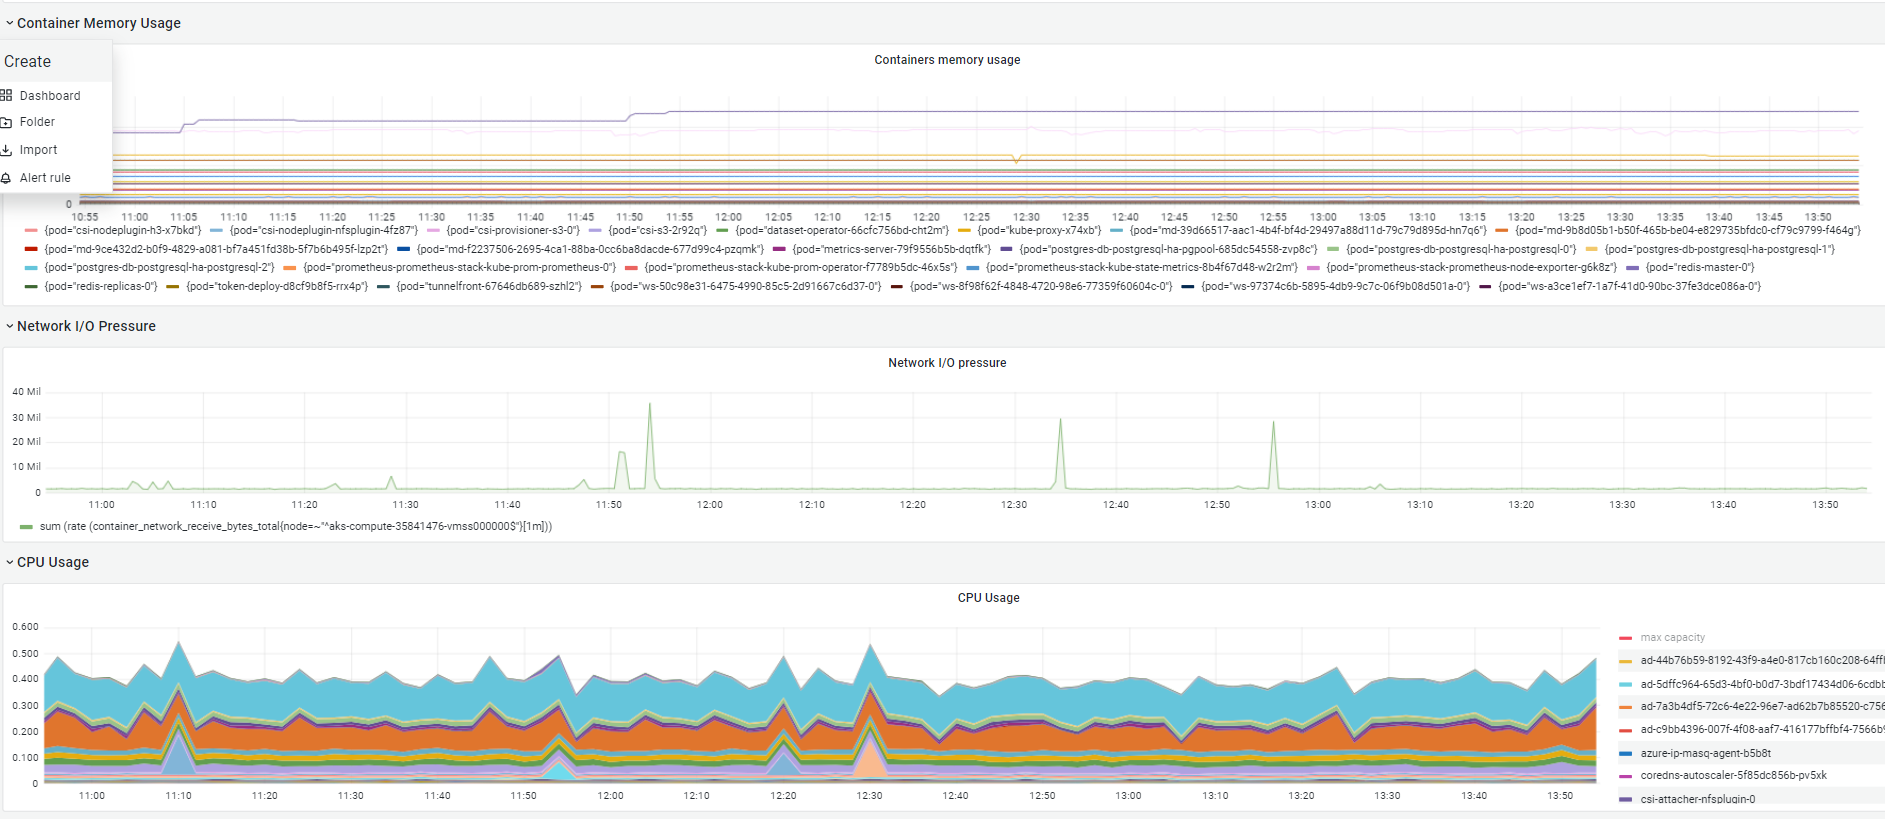
Container Memory Usage
Network I/O Pressure
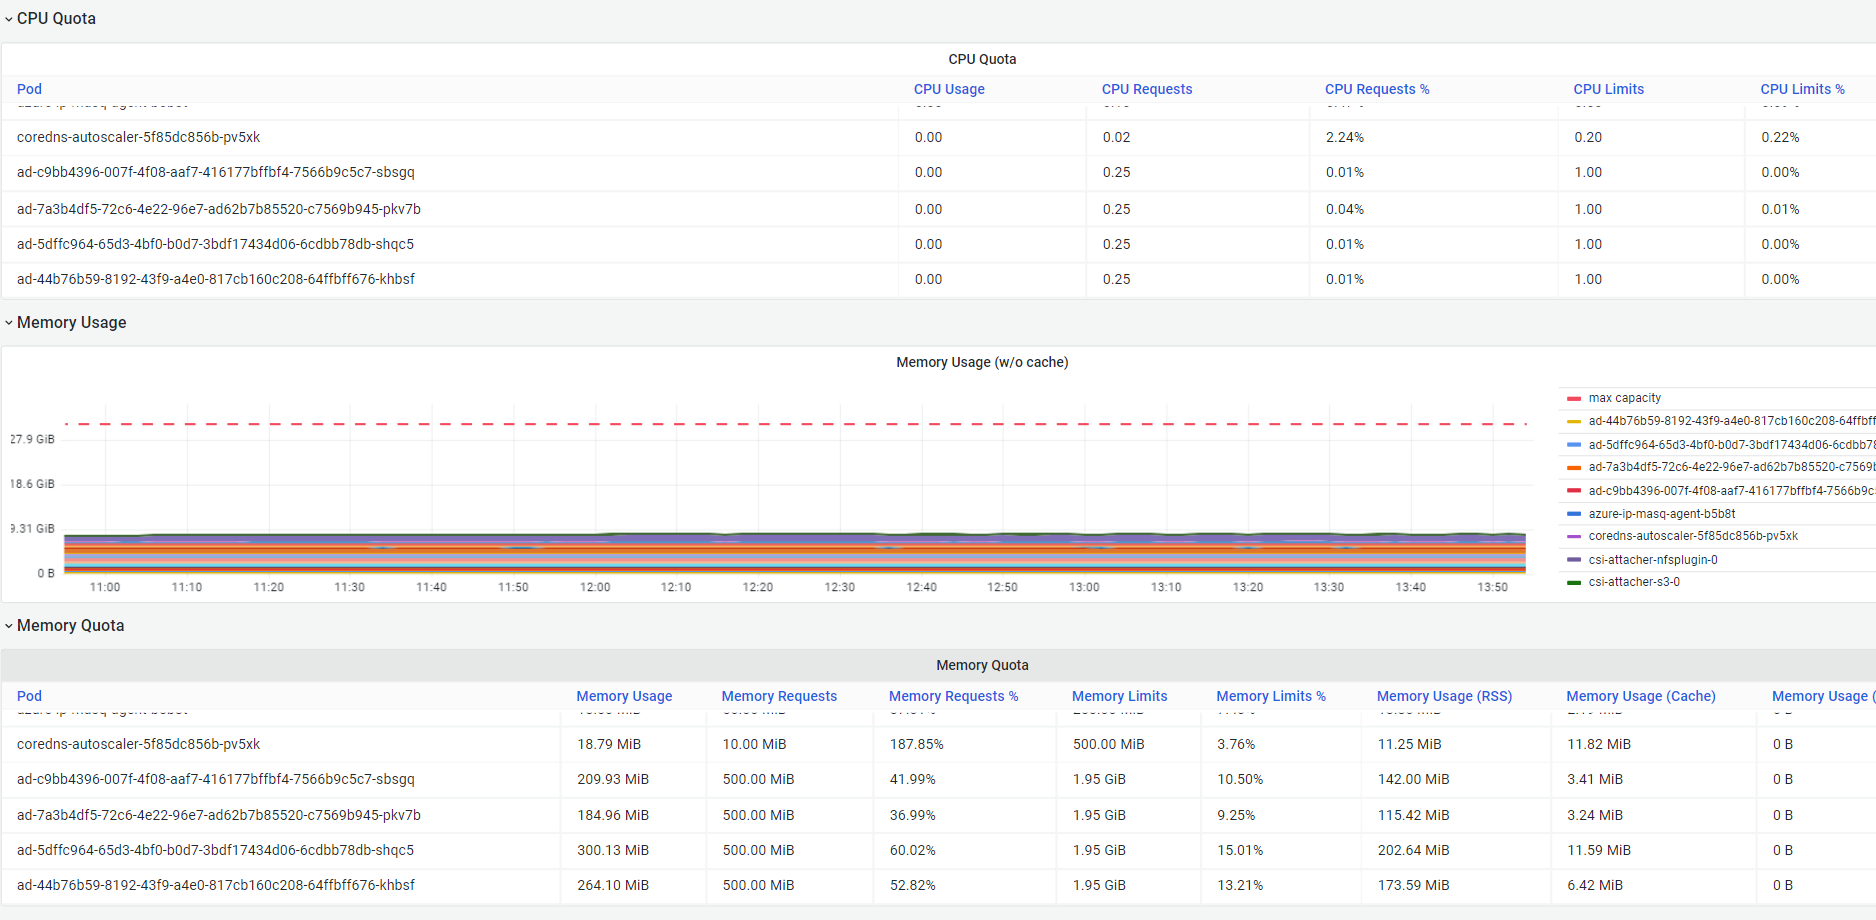
CPU Usage and Quota
Memory Usage and Quota
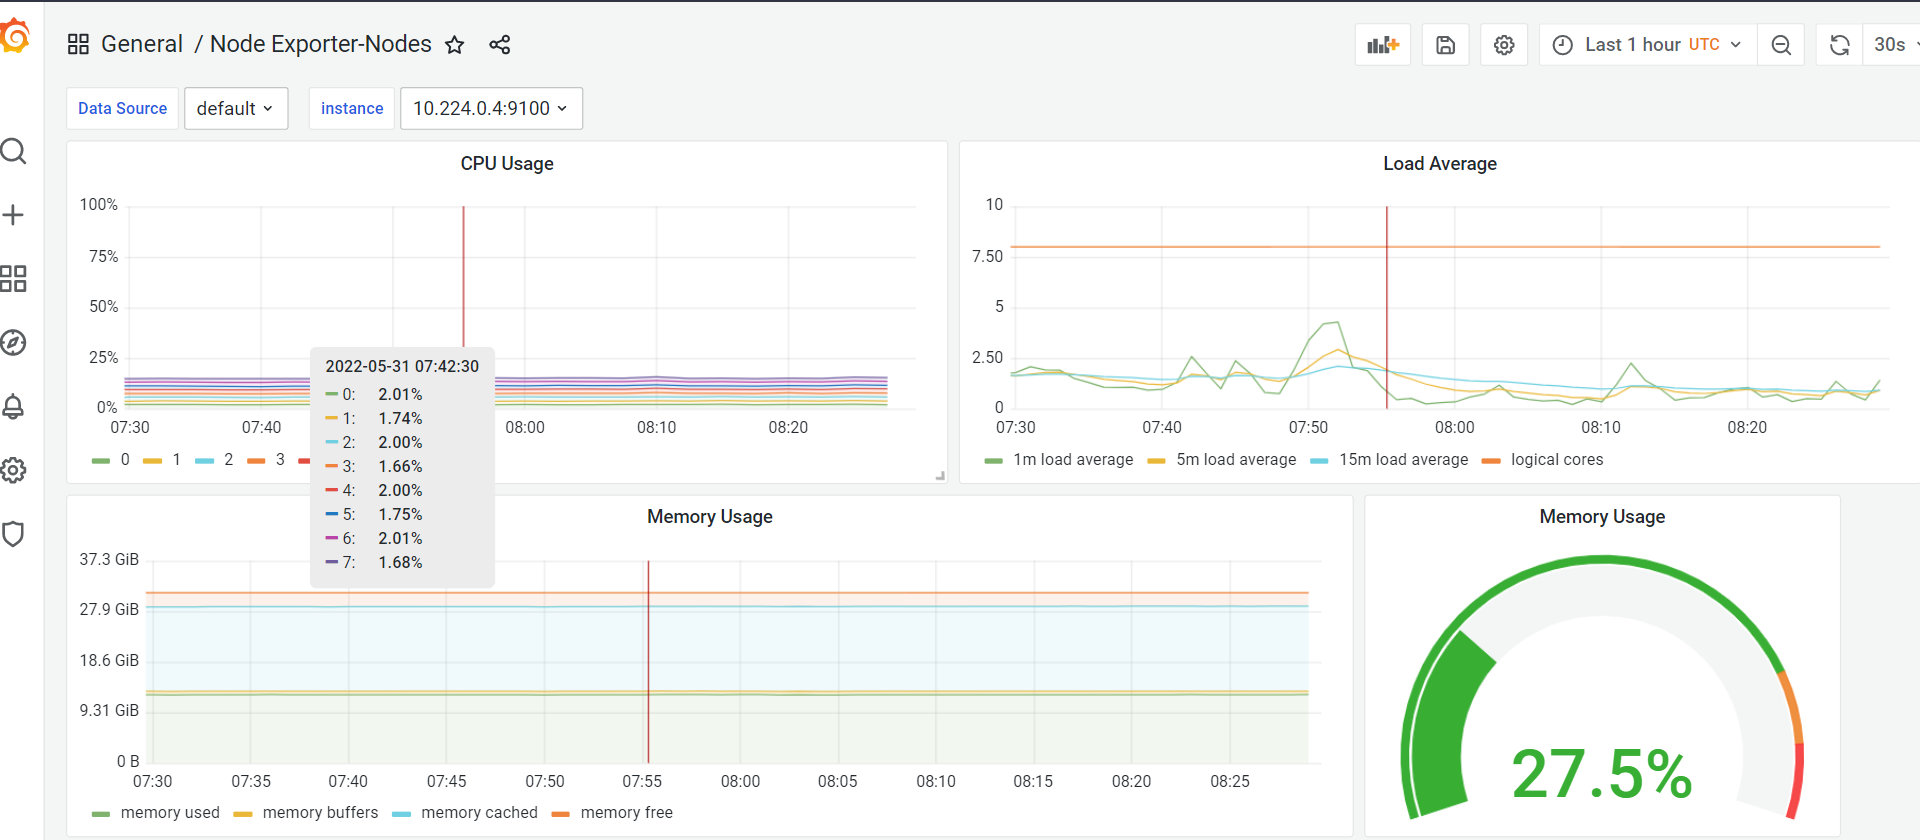
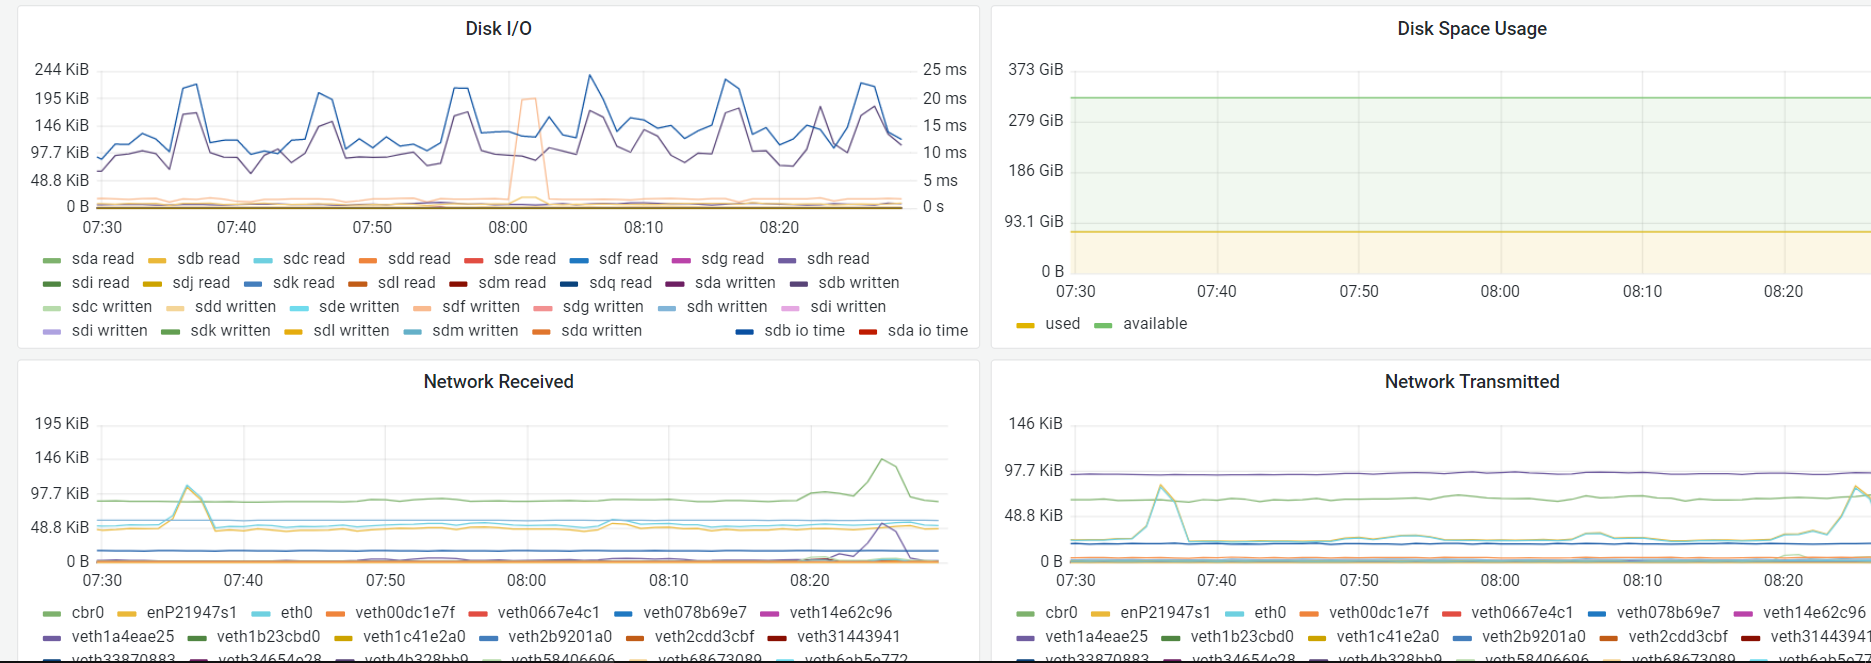
Node-Exporter Dashboard
Kubernetes Node-Exporter dashboard will give you the entire data of node exporters by the instance types present in the given cluster which contains the following:
CPU Usage and Load Average
Memory Usage
Disk I/O and Disk Usage
Network received and transmitted
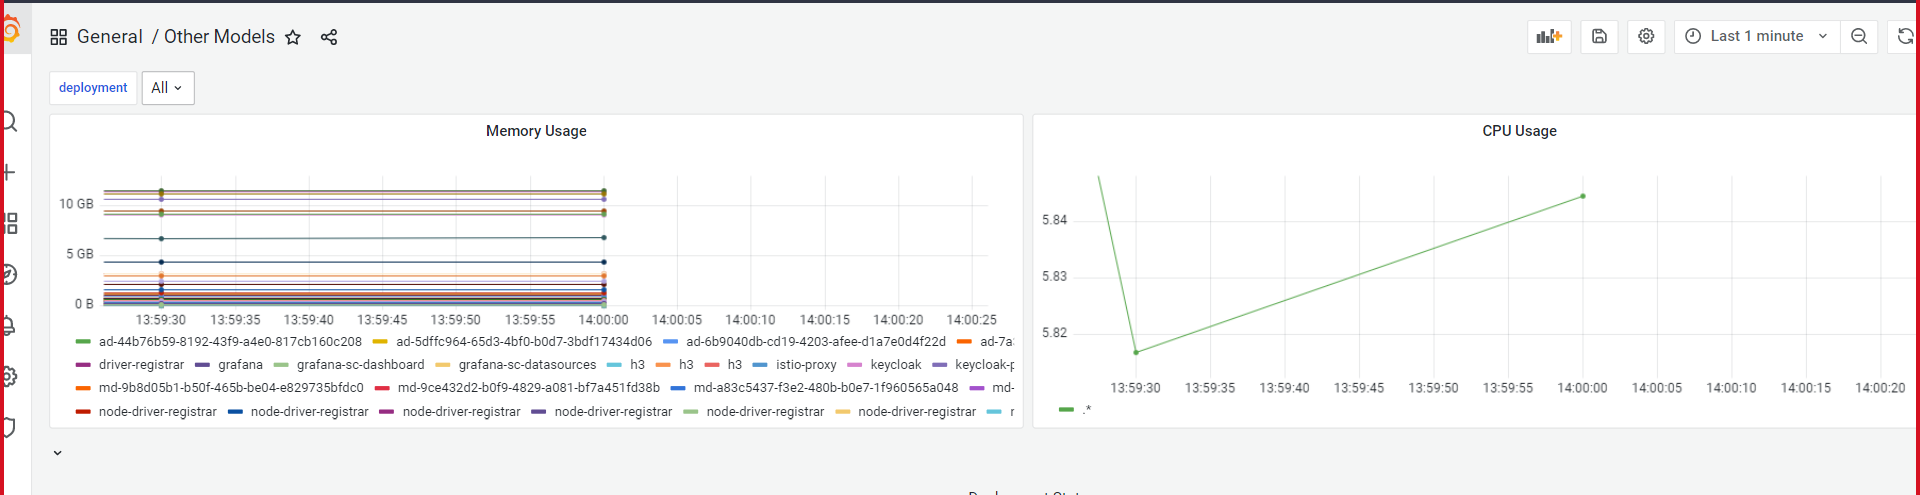
Other Models Dashboard
Other Models dashboard will give you the statistics of your model deployed into your existing kubernetes cluster with the deployments present. It contains the following data:
Memory Usage
CPU Usage
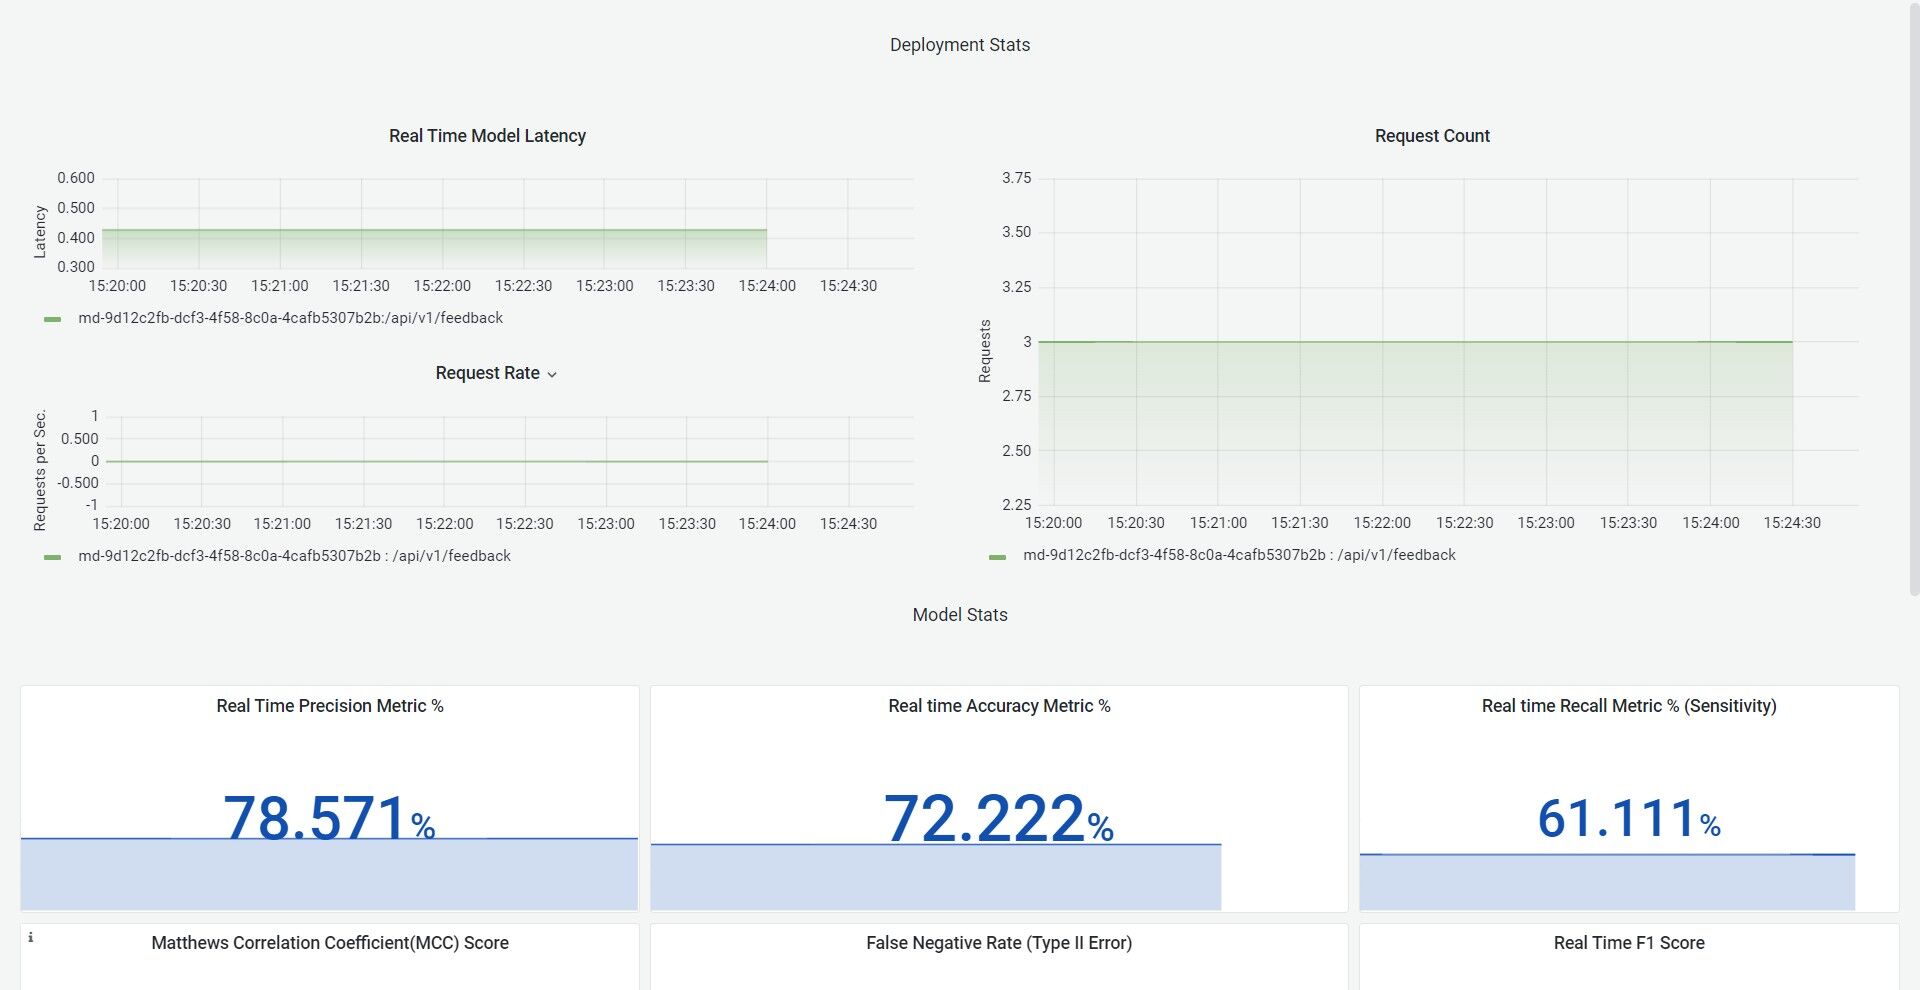
Classification Dashboard
As documents are classified, you can view statistics about the classification process, such as how much time has passed since the process started, how much container memory and container CPU usage is done so far in the classification process.
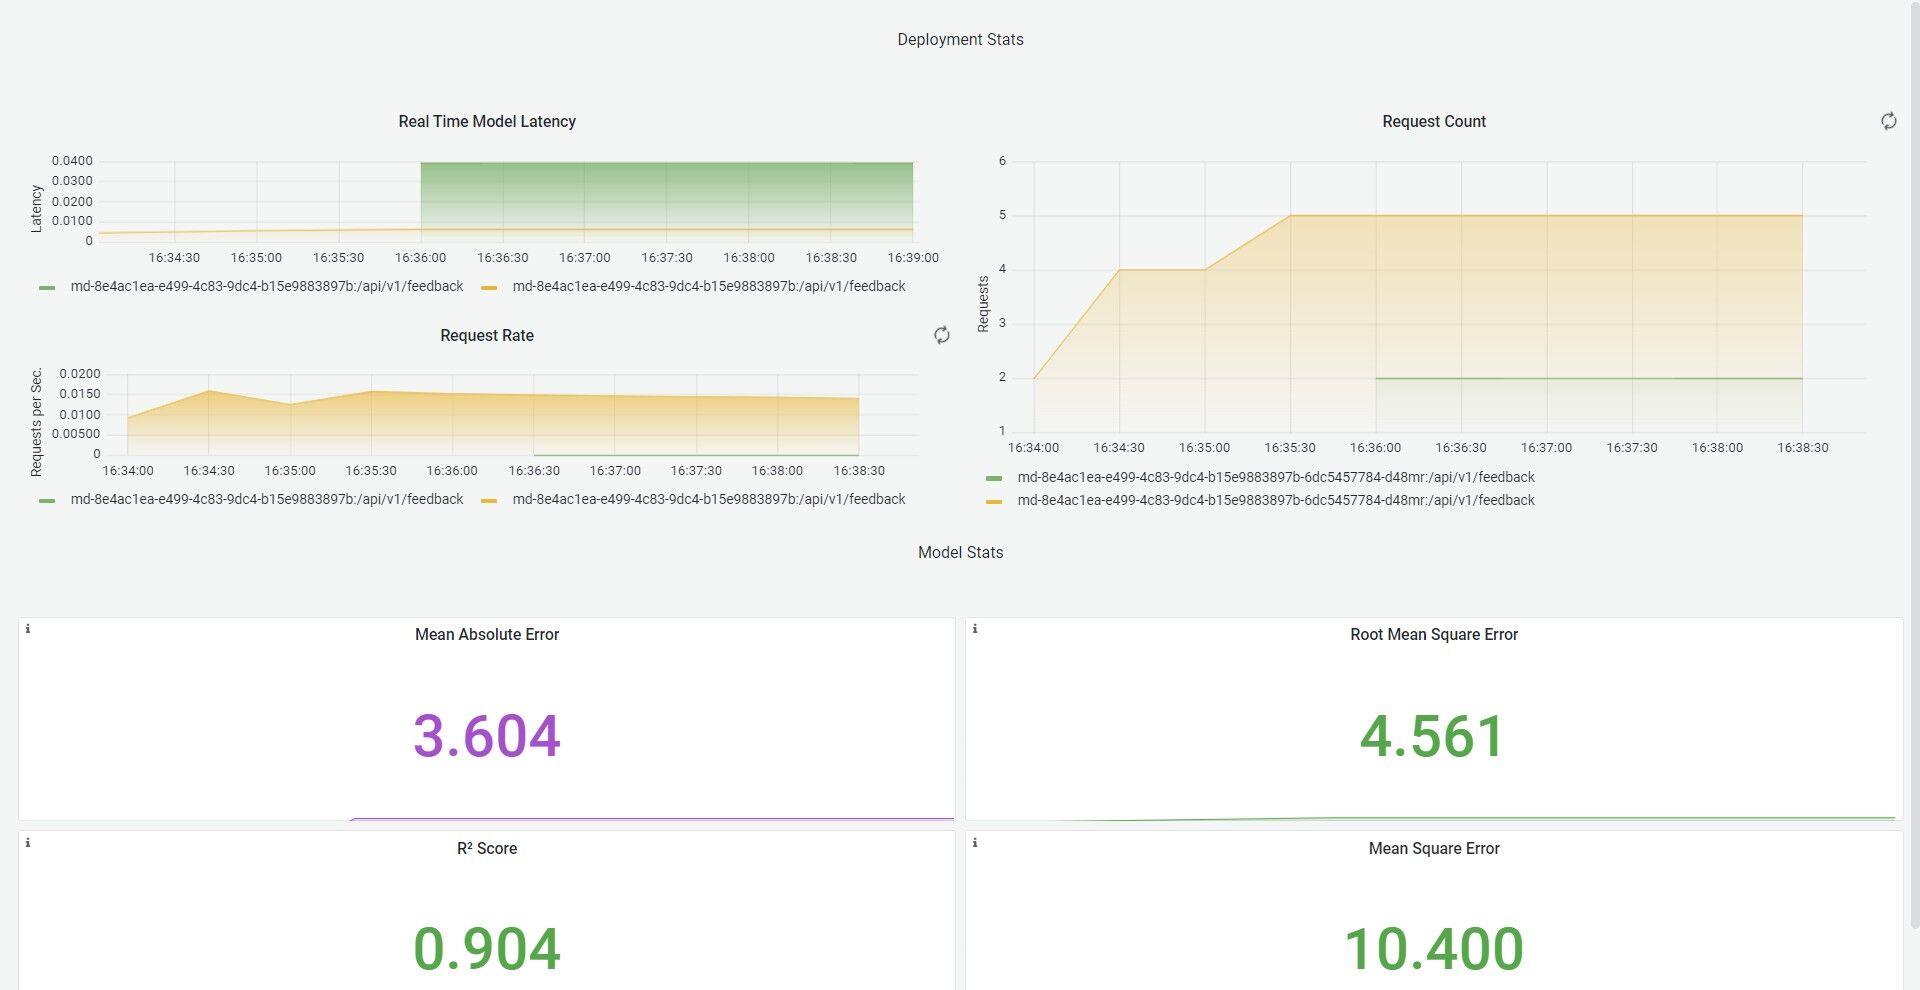
Regression Dashboard
Regression dashboard will provide the statistics of a regression model which provides a function that describes the relationship between one or more independent variables and a response, dependent, or target variable
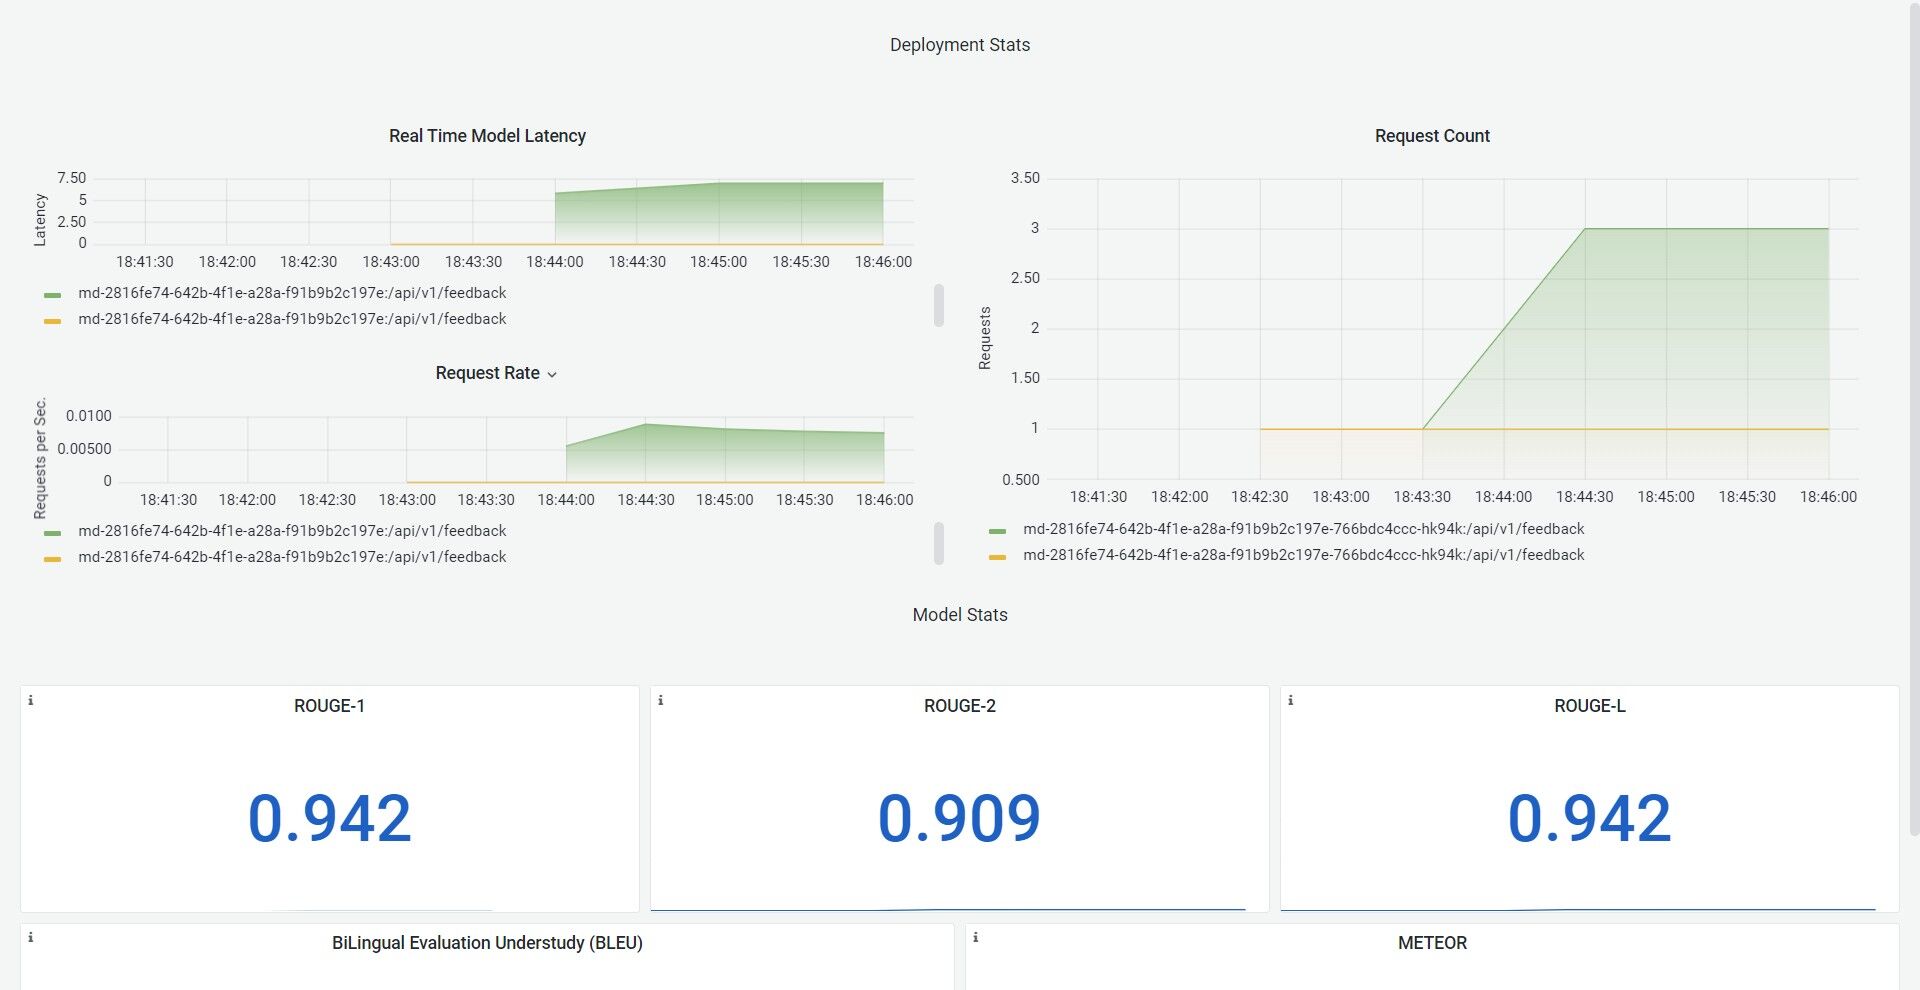
NLP Dashboard
NLP dashboard will provide the statistics of a NLP model which provides a function that describes the relationship between one or more text contents, like how much similar they are to each other, are they conveying the same message.These insights enable proactive maintenance, improvement, and optimization of the model, facilitating timely corrective actions and enhancing its overall performance in production environments.